See the full presentation in PDF
Carlos A. Garibaldi Executive Secretary
Latin America and Caribbean Petroleum
AGENDA
• Petroleum in the Economies
• Energy Matrices
• Emissions
• Petroleum Production Trends and Reserves
• LAC’s Petroleum Maps
• Stellar Oil Play Highlights
• Breakeven Prices and Investments
• Challenges for Upstream and Downstream
• Transformation in Response to Energy Transition
• Future Trends in LAC?
Indicators for major regional economies (2021 data)
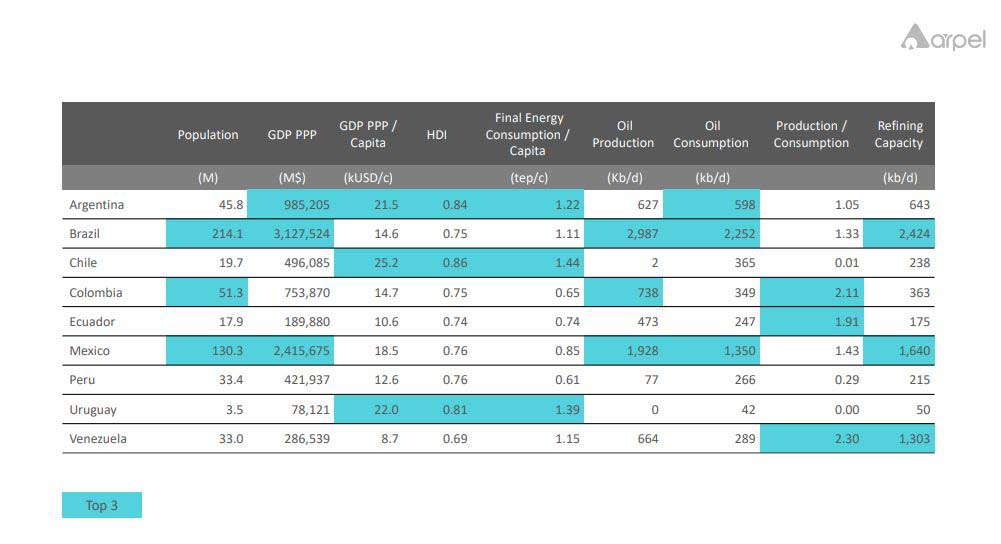
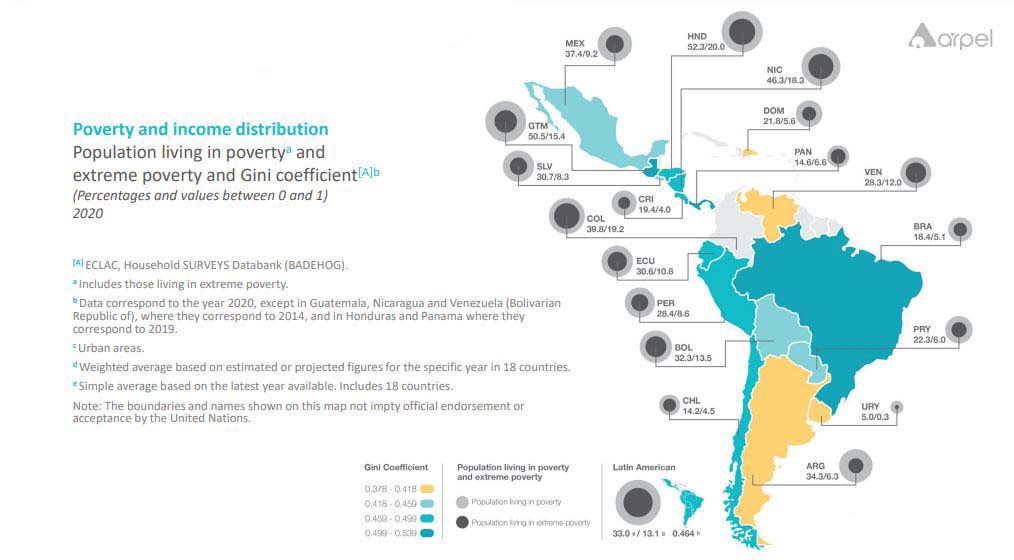
1/3 of Population in Poverty and 13% in Extreme Poverty
LAC has a relatively cleaner Primary Energy Matrix, but Oil plays a fundamental economic role
LAC Primary Energy Matrices (2021)
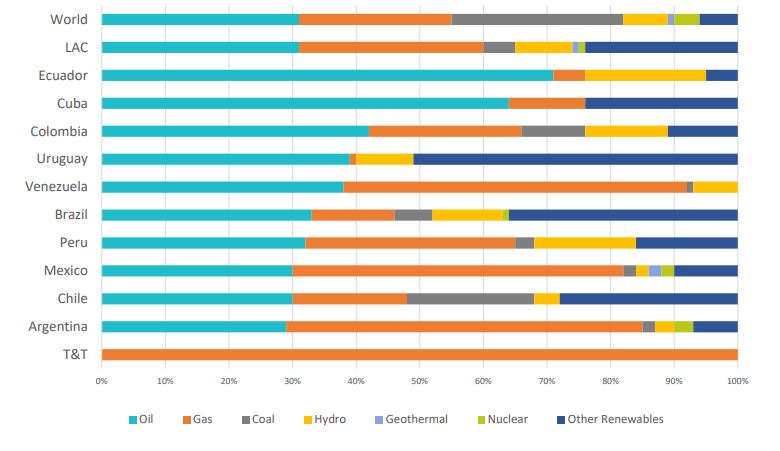
LAC:
- 31% Petroleum
- 60% Hydrocarbons
- Only 5% Coal (27% Globally)
- 35% Nuclear + Renewables (vs. 18% Globally)
LAC already ahead in the Energy Transition
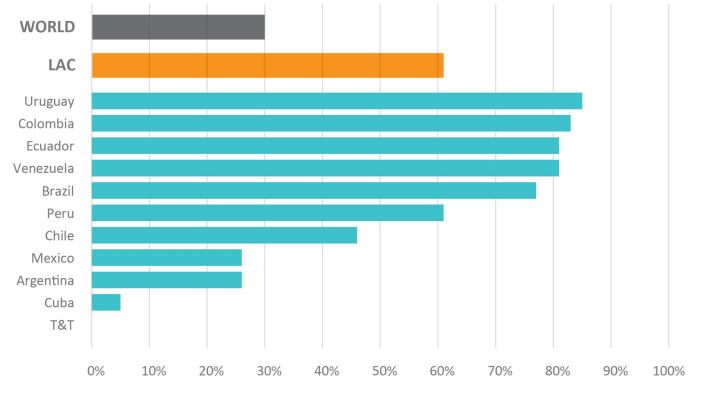
• 97% electricity access rate
• 61% Renewable
- Power Generation (mostly Hydro) vs. Global 30%
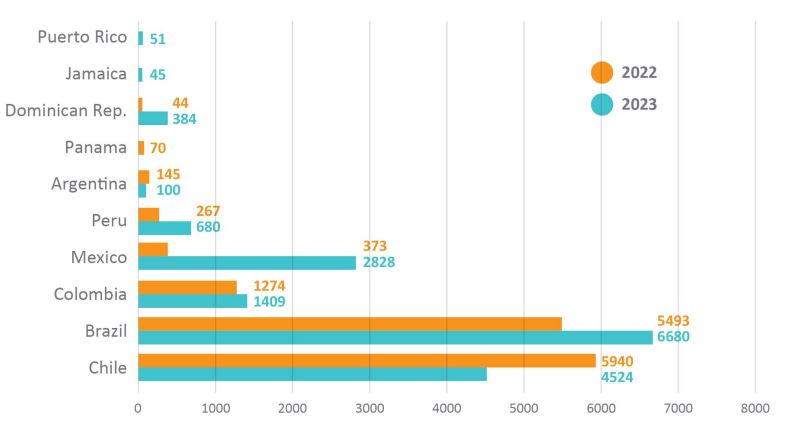
Brazil and Chile regional leaders in Solar
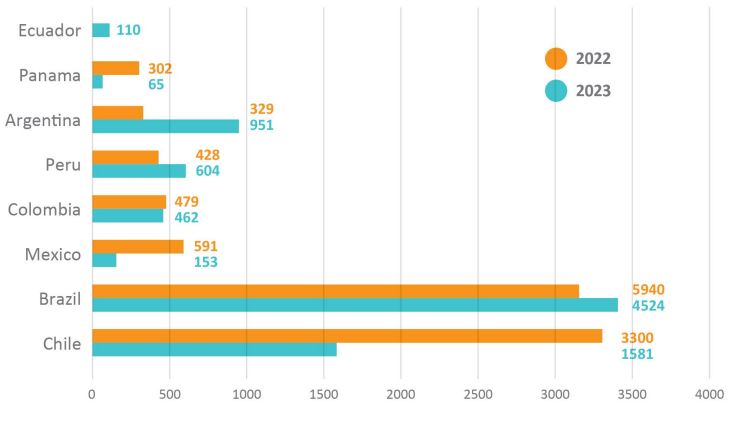
Brazil and Chile also leaders in Wind
Contruction phase star for wind farms: 2022 vs 2023 (MW)
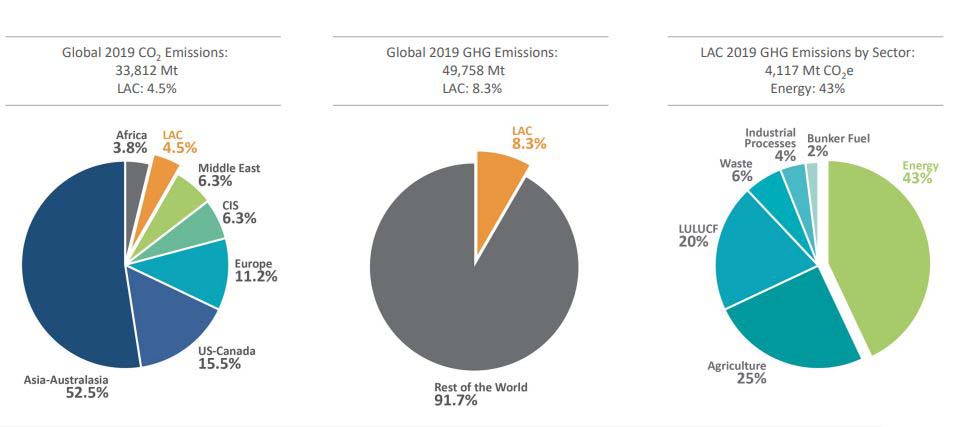
LAC is a marginal contributor to CO2 and GHGEmissions
-
Energy sector in LAC not the single culprit of GHG Emissions in LAC (43% vs. 75% globally)
LAC contributes with 9% of Global Petroleum Production
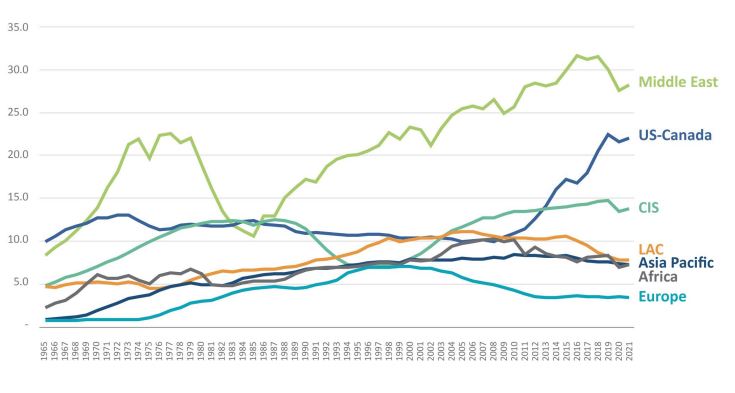
- LAC’s contribution has ranged 9-15%
- 9% in 2021 and seems in decline
Brazil now leading in LAC’s Petroleum Production
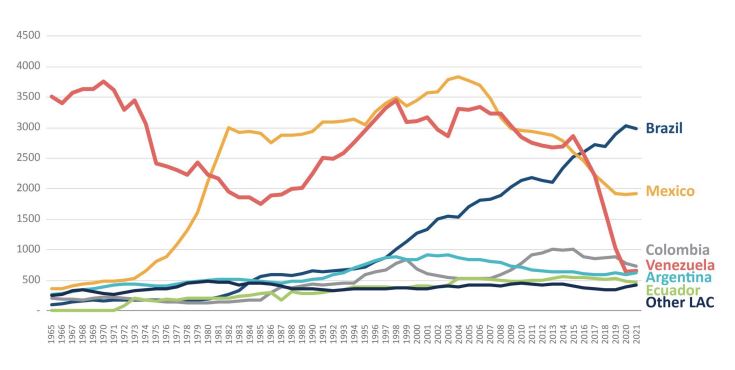
- Historically dominated by Venezuela and Mexico
- Currently dominated by Brazil
- Colombia, Argentina and Ecuador in a second tier
LAC 2nd in Proved Petroleum Reserves but 4th in Production
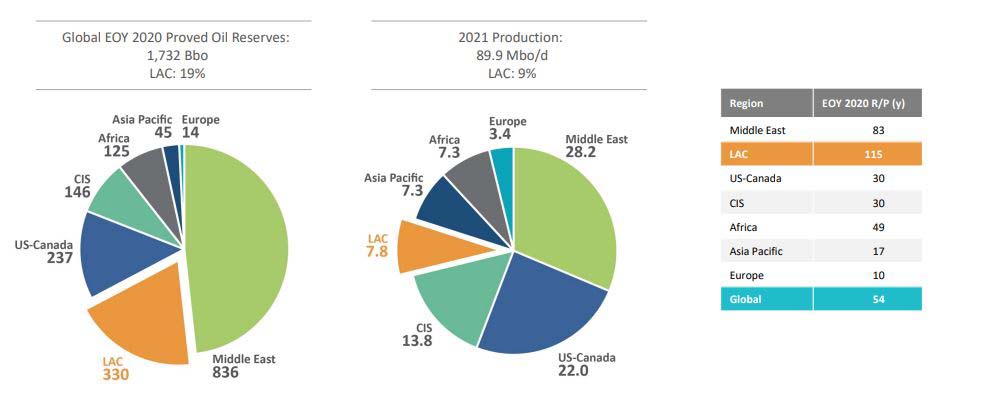
- Apparent dissonance between contributing 9% of production and holding 19% of Proved Reserves
- Evident in the R/P
Venezuela 1st in Proved1 Petroleum Reserves but 4th in Production
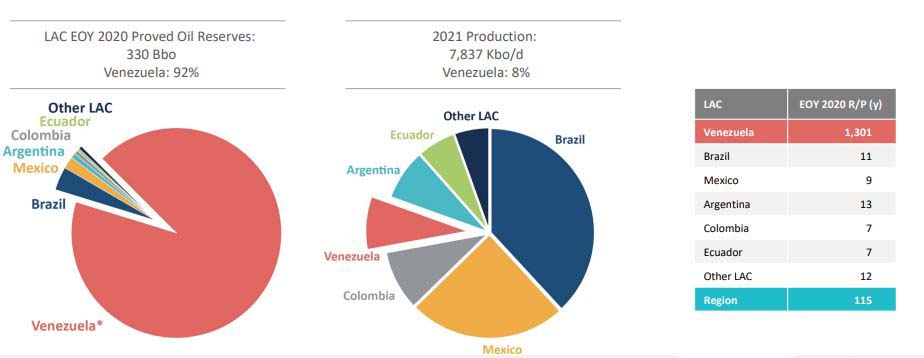
- Apparent dissonance between Venezuela contributing 8% of production and holding 92% of Proved Reserves
- Evident in the R/P. Even at historical peak levels of 3.5 Mbo/d, R/P would be 238 y. Resources are there (ultra- heavy oil) likely a reserve classification issue. Proved
Reserves should be ~ 75 (60% H-EH) in lieu of 303 Bbo
Northern Cone: rising Guyana-Suriname
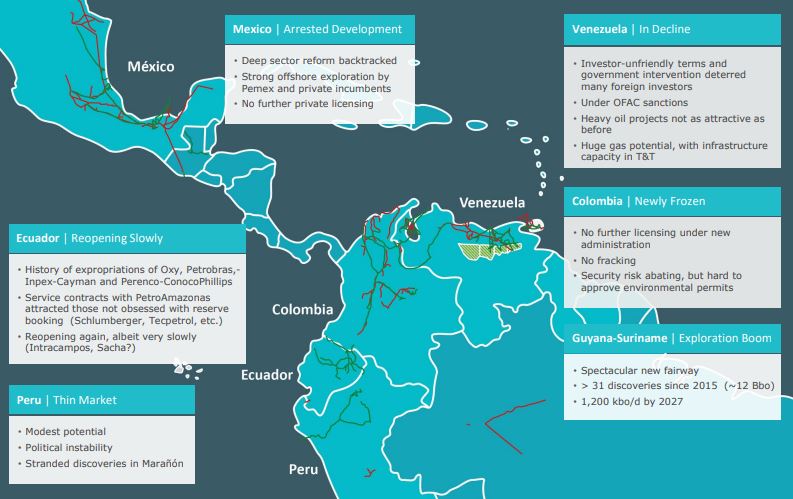
- Venezuela and Mexico in production decline
- Guyana-Suriname on the up
Play Highlight: Guyana-Suriname Equatorial Margin
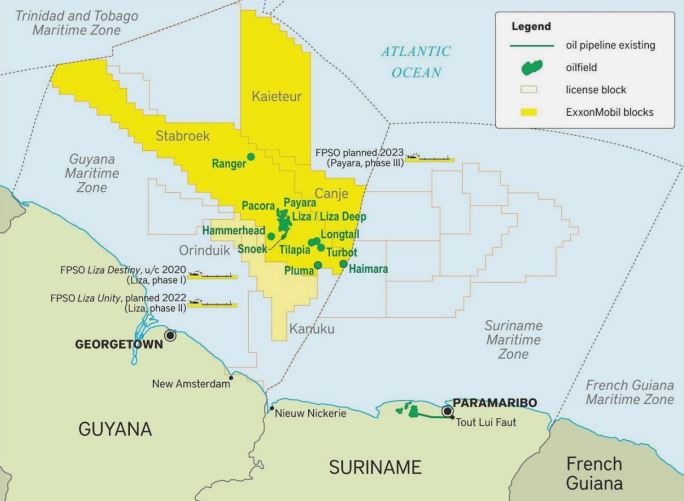
- Prolific source rock and large influx of reservoir-prone sands from Guyana Shield
- Efficient conduits from platform/slope canyons to slope and basin floor fans
- > 31 discoveries (and still counting)
- Very immature; far from saturation in creaming and breakeven cost curves
- Producing 380 Kbo/d. Expected to reach 1,200 Kbo/d by 2027
Southern Cone: Brazil outstanding and Argentina emerging
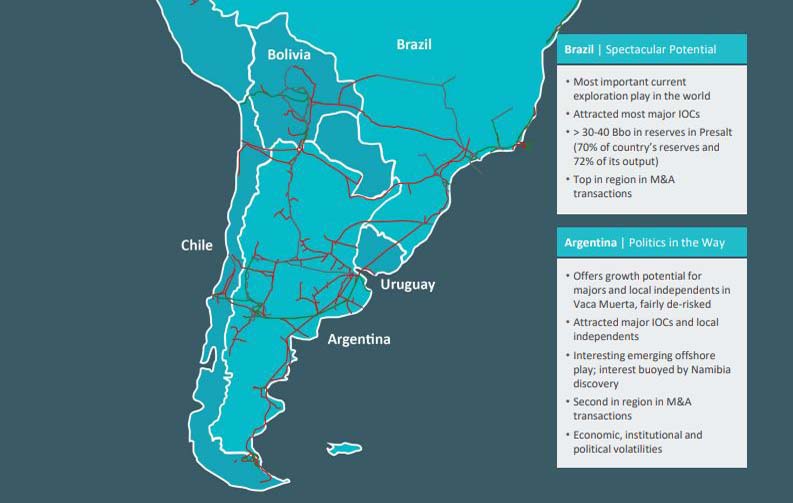
- Brazil’s petroleum booming
- Argentina’s shale potential supported by specific incentives but hindered by general economic and institutional volatility
Play Highlight: Brazil Presalt
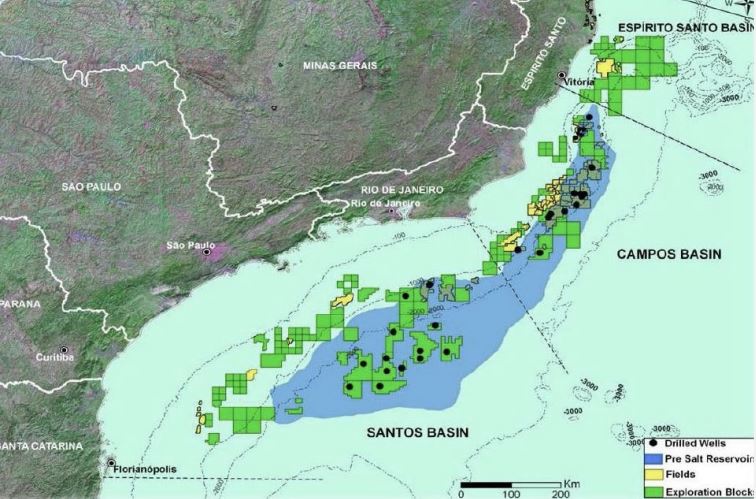
- Giant and supergiant fields
- Excellent quality carbonate reservoirs
- Play at 5,000-6,000 mbsl, below a 2,100 m water column and sediments including ~ 1 Km of salt
- Wells deliver 17 Kbo/d on average, and can reach 60 Kbo/d
- By 2035 Brazil could be producing 7-9 Mbo/d
Play Highlight: Argentina’s Vaca Muerta
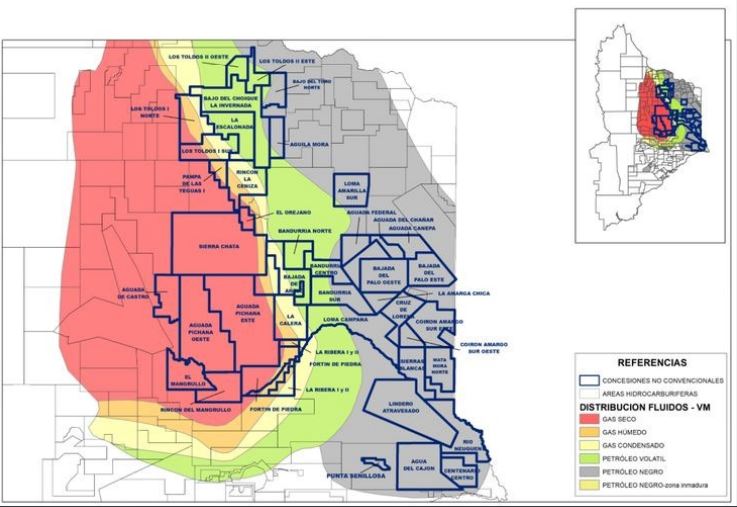
- Best shale rock outside of USA
- 50% of Permian acreage
- ~1,900 wells vs. ~45,000 in Permian
- Similar rock quality, but lessthickness than Permian
- Only ~ 1/3 of acreage under concession
- Only ~ 5% under development
- Producing 280 kbo/d + 1.8 Bcfg/d (vs. 5,440 kbo/d in Permian)
- Potential for 20 Bbo + 200 Tcfg
Breakeven Curves ($/bo): room to grow
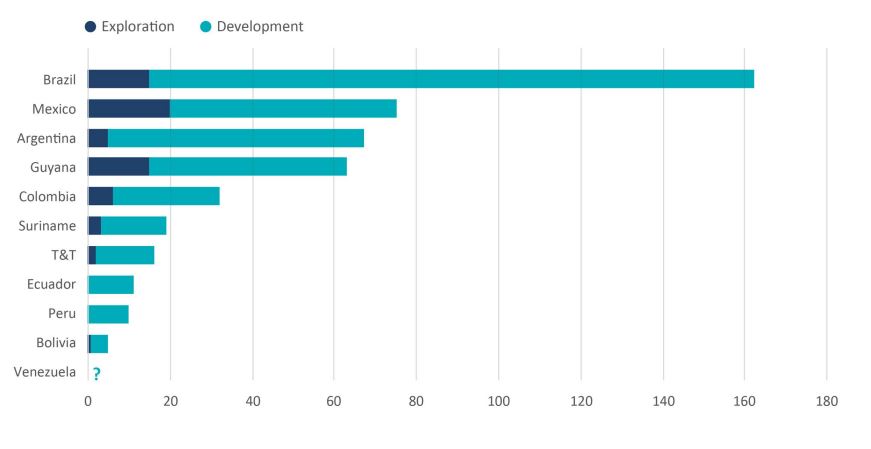
Potential supply from 2020-25 sanctioning activity among top offshore countries
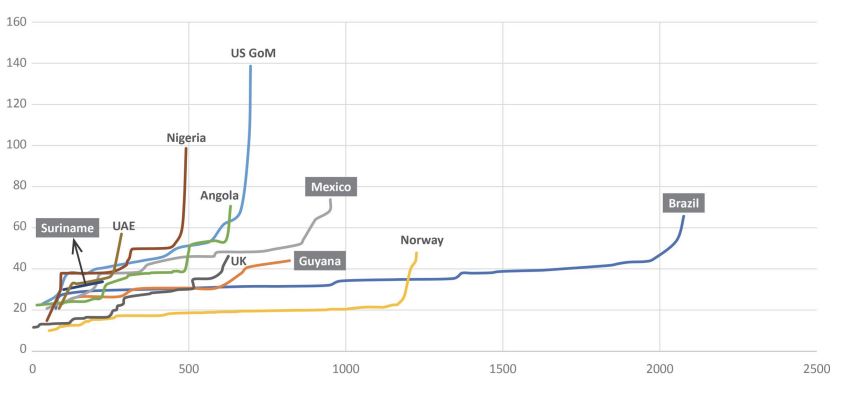
Planned production capacity in thousand barrels per day
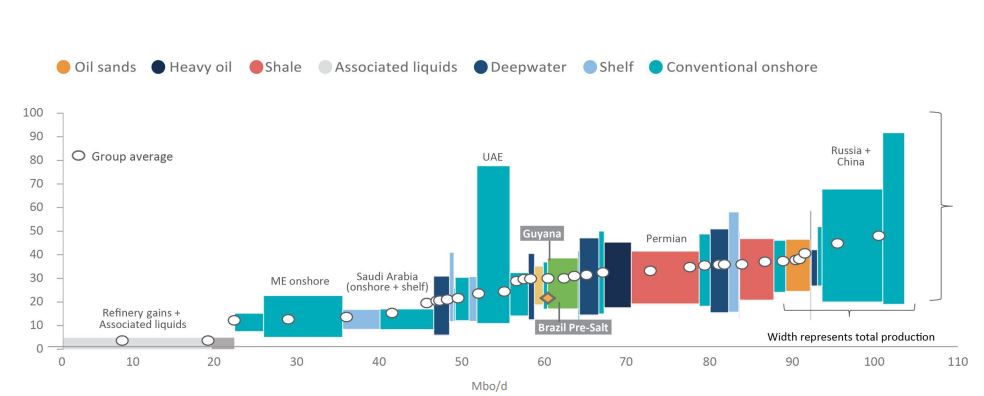
Breakeven Prices ($/bo): Guyana and Brazil are competitive
2030 Global Oil Cost of Supply
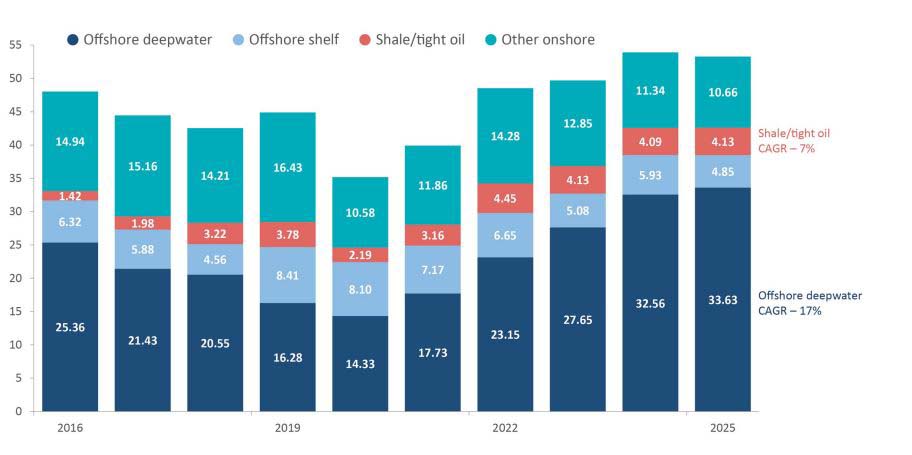
Investment Trends driven by Offshore
(BUSD)
2021-2030 Upstream Investments led by Brazil
(BUSD)
NOCs/SOEs are more exposed
- Region holds ~ 60% of the heavy oil resources of the planet (mostly in Venezuela; fairway extends to Colombia, Ecuador and Peru)
- Many refineries have marginal scale and outdated configuration, in countries that export crude and lower quality products and must import high quality products
- Growing competition from biofuels and electric mobility, growing operational and regulatory standards, growing emission, pollution and water demands for maintaining/renewing their social licenses
- Shrinking refining profit margins and very high costs of structural transformation in scale and in configuration
- Societal pressures less exacerbated than in the EU, but growing
- Barriers to debt and equity funding for E&P, even for decarbonization of O&G operations
NOCs/SOEs are more exposed
- They control most of the oilreserves
- Specific weight in the economies and employment in their countries: must supply energy at accessible prices to lift significant population segments from poverty
- Some have higher difficulties accessing capital and technology
- Due to fiduciary duties and political scrutiny, they tend to have lesser decision and financial independence and to be more conservative and risk-averse
- They require clear alignment of Government policies addressing the tension between developing and monetizing their resources, and social apprehensions about the environment and climate change
Transformation in response to Energy Transition
- Countries facing the “energy trilemma”: Energy Security (and Sovereignty) – Equitable Access – Environmental Sustainability, are sometimes lacking clear policies, plans, and regulatory frameworks to navigate their Energy Transitions
- Eclectic energy and climate vulnerability region one path doesn’t fit all (Transitions are plural)
• Some net exporters, some crude exporters that are significant product importers, some are practically self-sufficient, others are net importers
•Coastal areas and insular countries especially vulnerable to climate risk - Transitions must be “just”:
• LAC a marginal contributor to global emissions:
4.5% CO2 and 8.3% GHG
• 61% of power from renewable sources
• 1/3 of population below the poverty lines and
13% extremely poor
• Right to develop and monetize natural resources in a sustainable way - Notwithstanding, decisively embarked in
Transformation, decarbonizing operations and diversifying energy matrixes with renewable energies - Many of our regional and national
O&G companies have adopted net zero targets
and are venturing into solar, wind, geothermal, lithium mining,
blue and green hydrogen, and reforestation
Future Trends in LAC?
- Challenging financing, permitting and/or marketing, particularly for heavier crudes
- More gas-weighted production, better infrastructure integrations in North Cone and in South Cone, more LNG exports
- Improve energy efficiency and decarbonize upstream, midstream and downstream operations and facilities
- Increase complexity and adapt refining configurations to accept biomass feeds, produce biofuels and blue H2, and integrate with petrochemicals
- Seek “super basin” synergies with renewables
- Natural gas as an uninterruptible-basis partner for renewables
- Huge sun belts: growing solar for local generation
- High wind alleys in Patagonia and coastal areas: highly efficient wind plants, green H2

